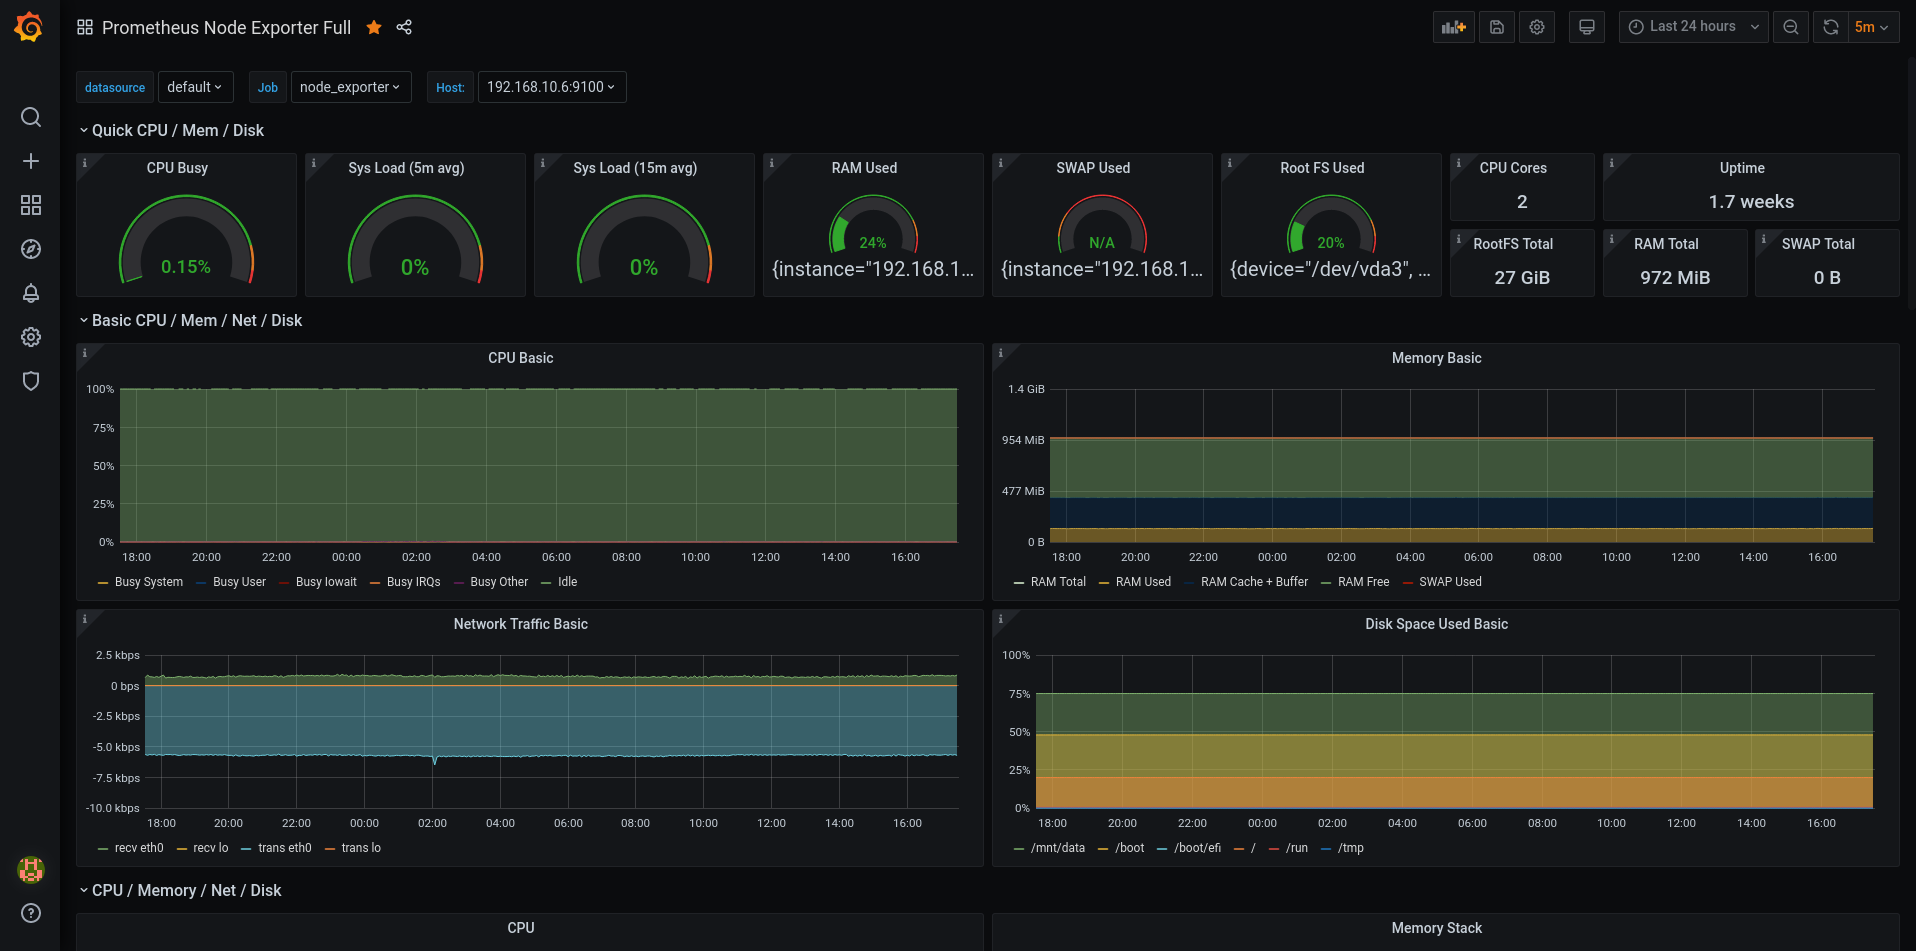
Hi. I did an updated version here, also with links to the files on Grafana. I had been fiddling with the new layout over a weekend, so this is how it ended out. ![]()
Oh, posting our dashboards?
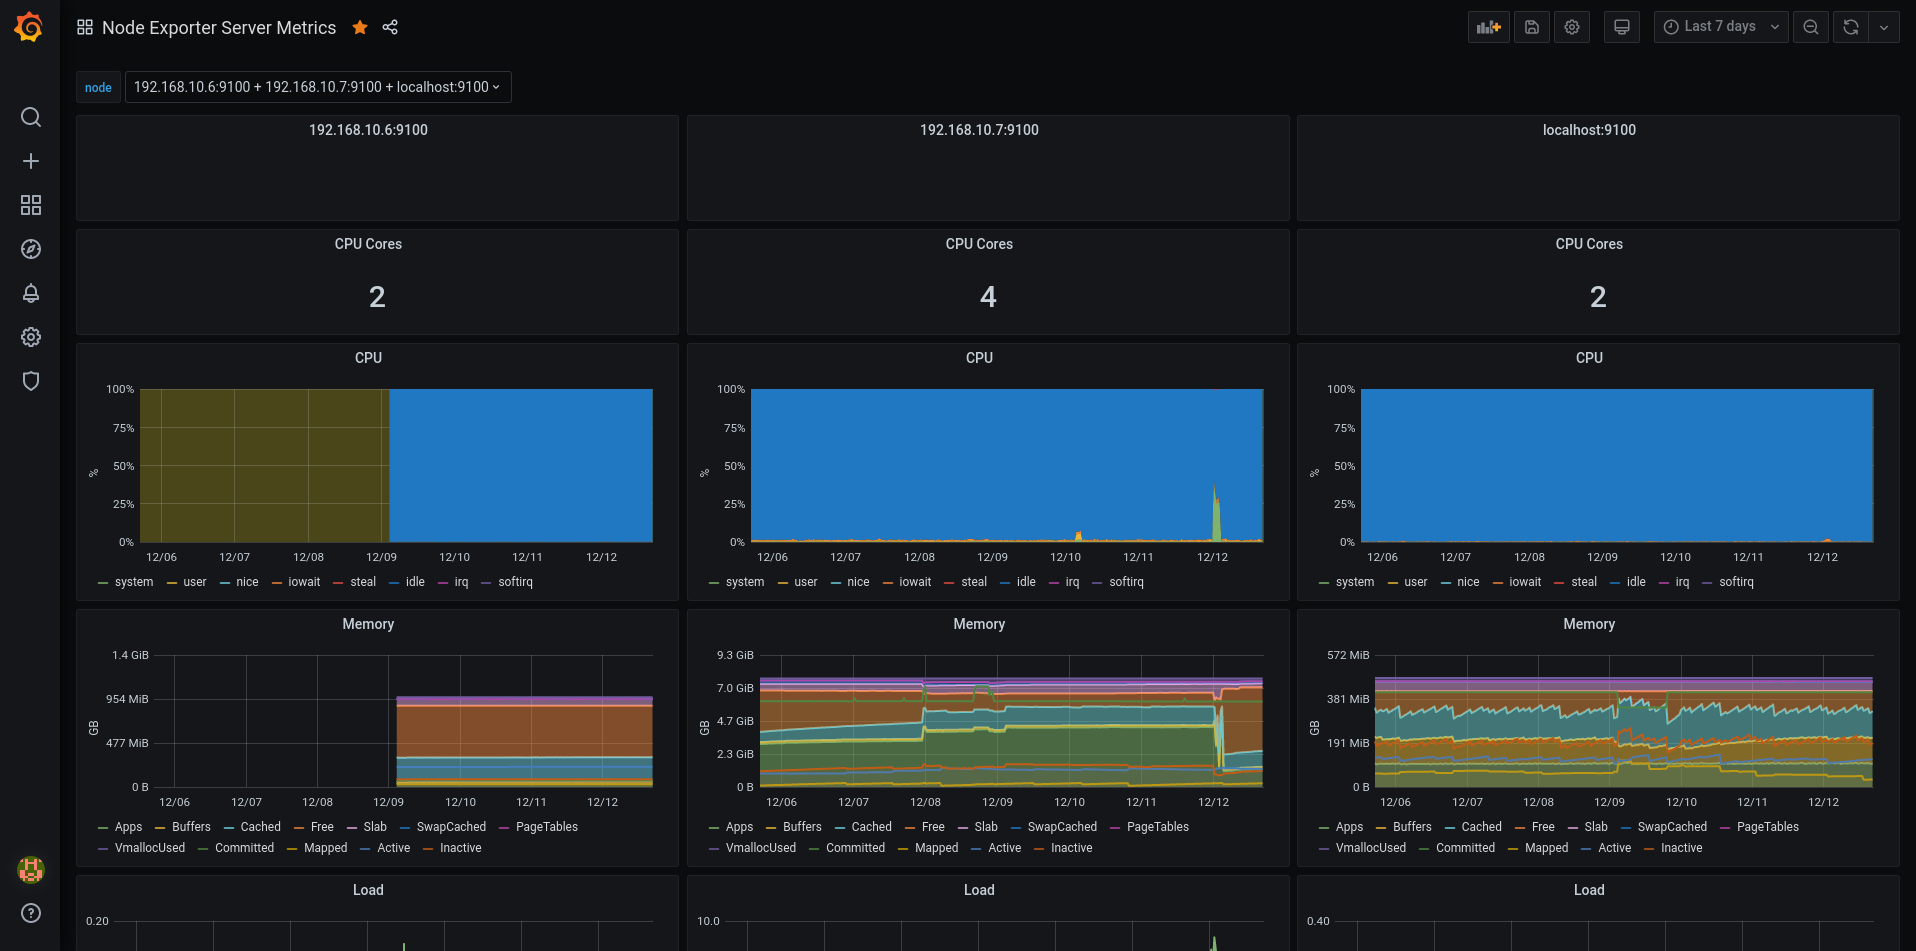
The first server is my file storage (samba / sshfs) VM that I forgot to add to monitoring for quite a while. 2nd is my Proxmox server and 3rd is (if it wasn’t obvious) the grafana server (which also has prometheus locally installed).
Seems like Firefox screenshot tool doesn’t know how to make a full page screenshot from Grafana dashboards. Interesting. Well, in any case…
I know it wasn’t a question aimed at me, but I’ll answer it too. I didn’t make it, there are lots of dashboards to grab from Grafana and other sources. But my total setup time for a grafana + prometheus server + installing node_exporter on all the clients took around 15 minutes. It is really easy to setup.
In part, the ease of setup was because grafana, prometheus and node_exporter are all in my distro’s main repo. But setting it up on CentOS / Rocky / Alma / Springdale / OEL or on Debian shouldn’t take more than 20-30 minutes either, just add the repo for prometheus and grafana and you’re good to go. Prometheus requires about 20 lines of config in its file. Grafana requires no fiddling other than changing the password for admin, downloading your dashboard and when you set it up, point it to prometheus metrics page. Node_exporter just needs to be downloaded, ran and enabled at startup.
One thing I didn’t take my time to set up was AlertManager, Prometheus’ own alert engine. With it, you can get to set thresholds and other alerts regarding hosts and services and you get them in a JSON format (IIRC), which you can use as a source for another Grafana dashboards (aptly named Prometheus AlertManager), like storage capacity warning messages, or host down and such. AlertManager can also send you mails, but I haven’t set up a mail server. It shouldn’t take too long to set AlertManager if you already have a mail server.
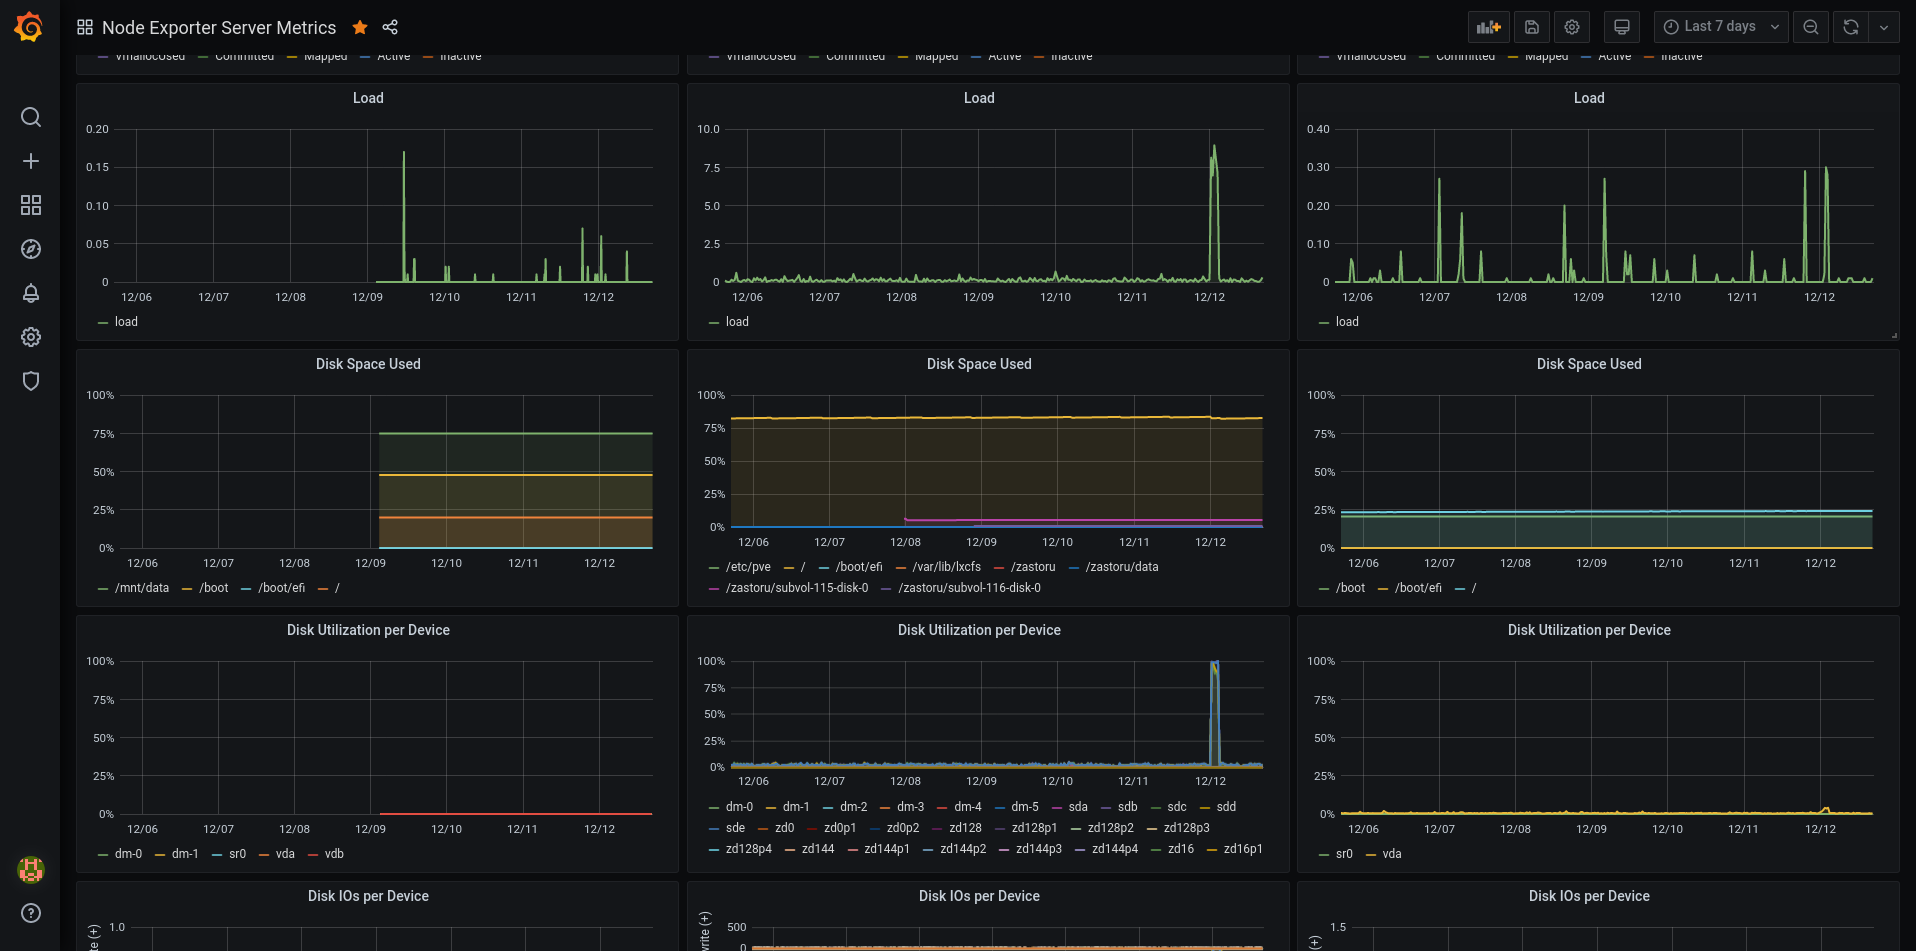
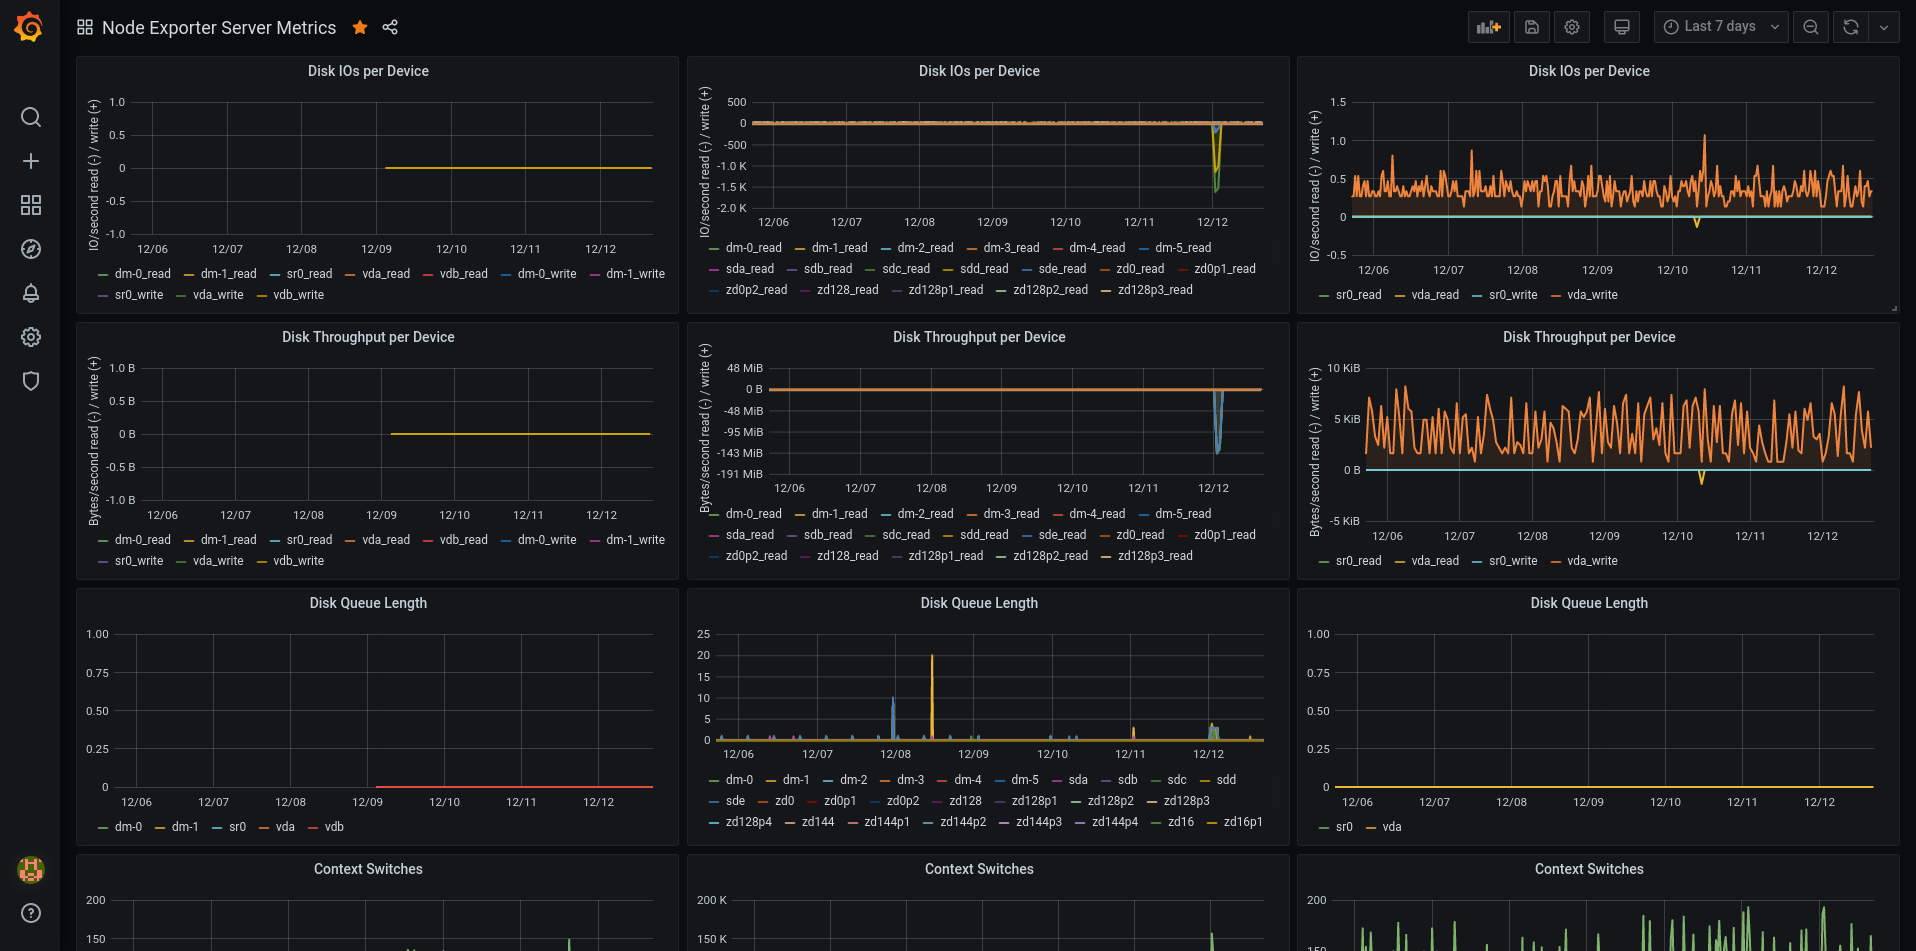
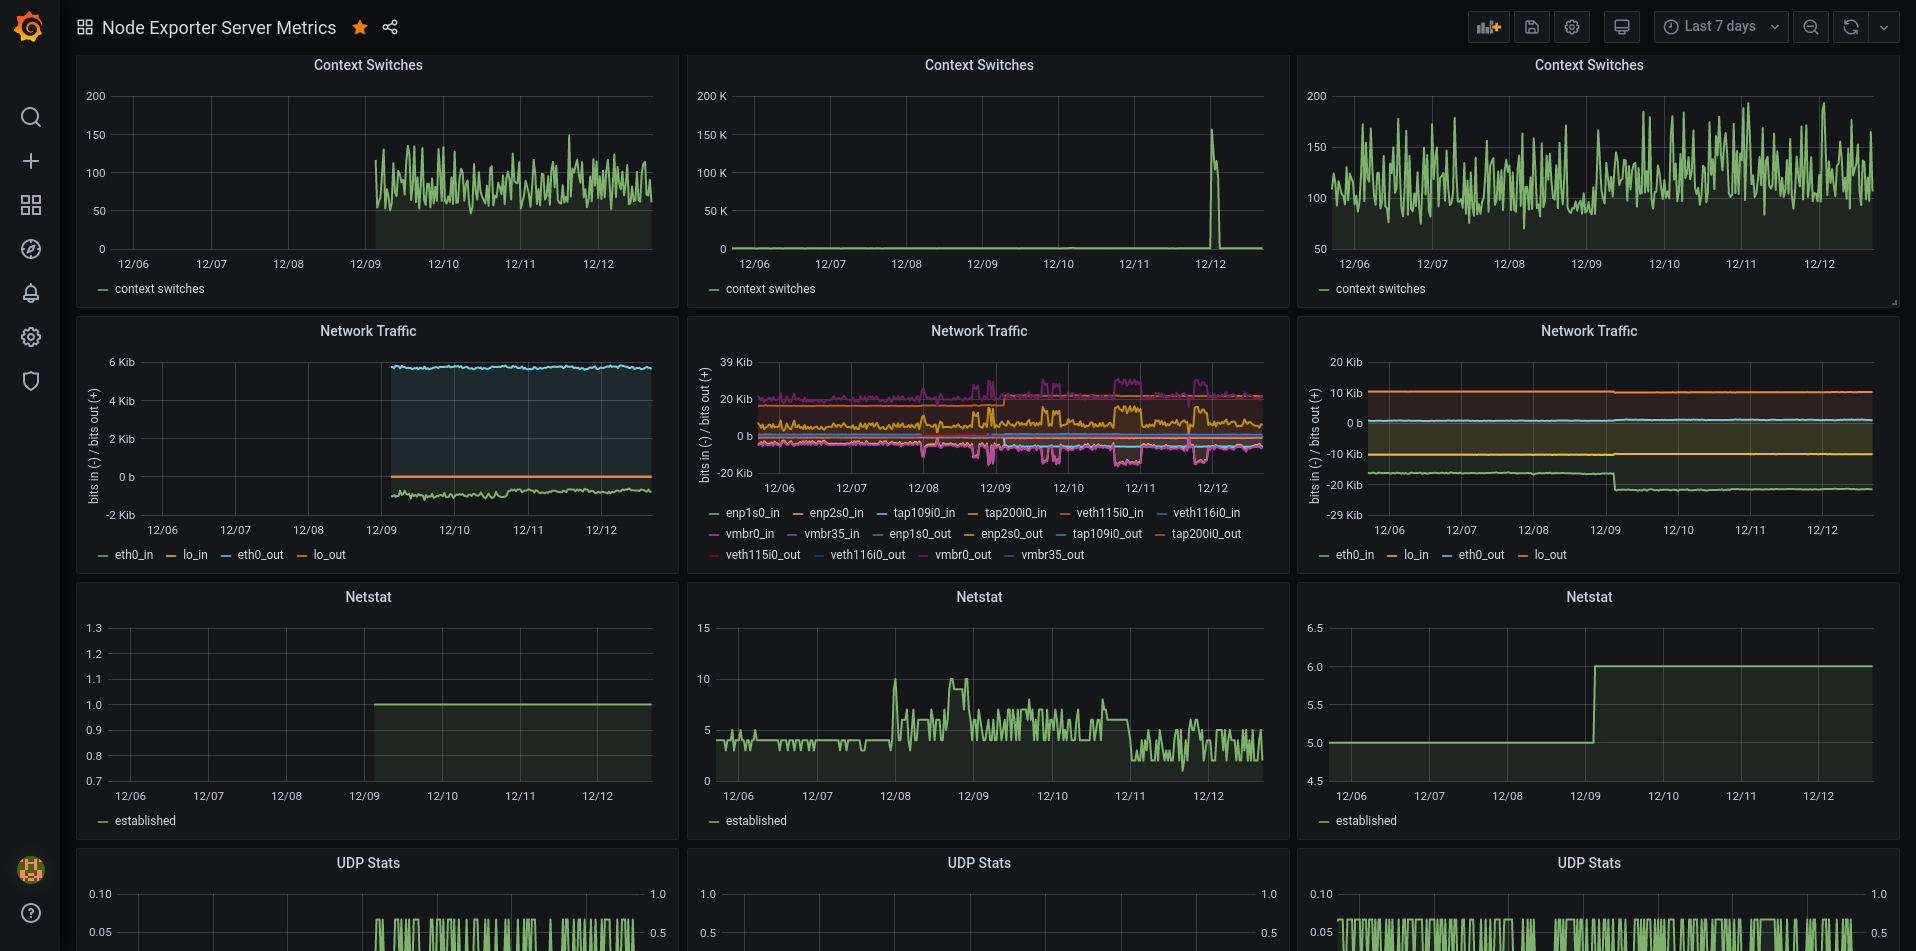
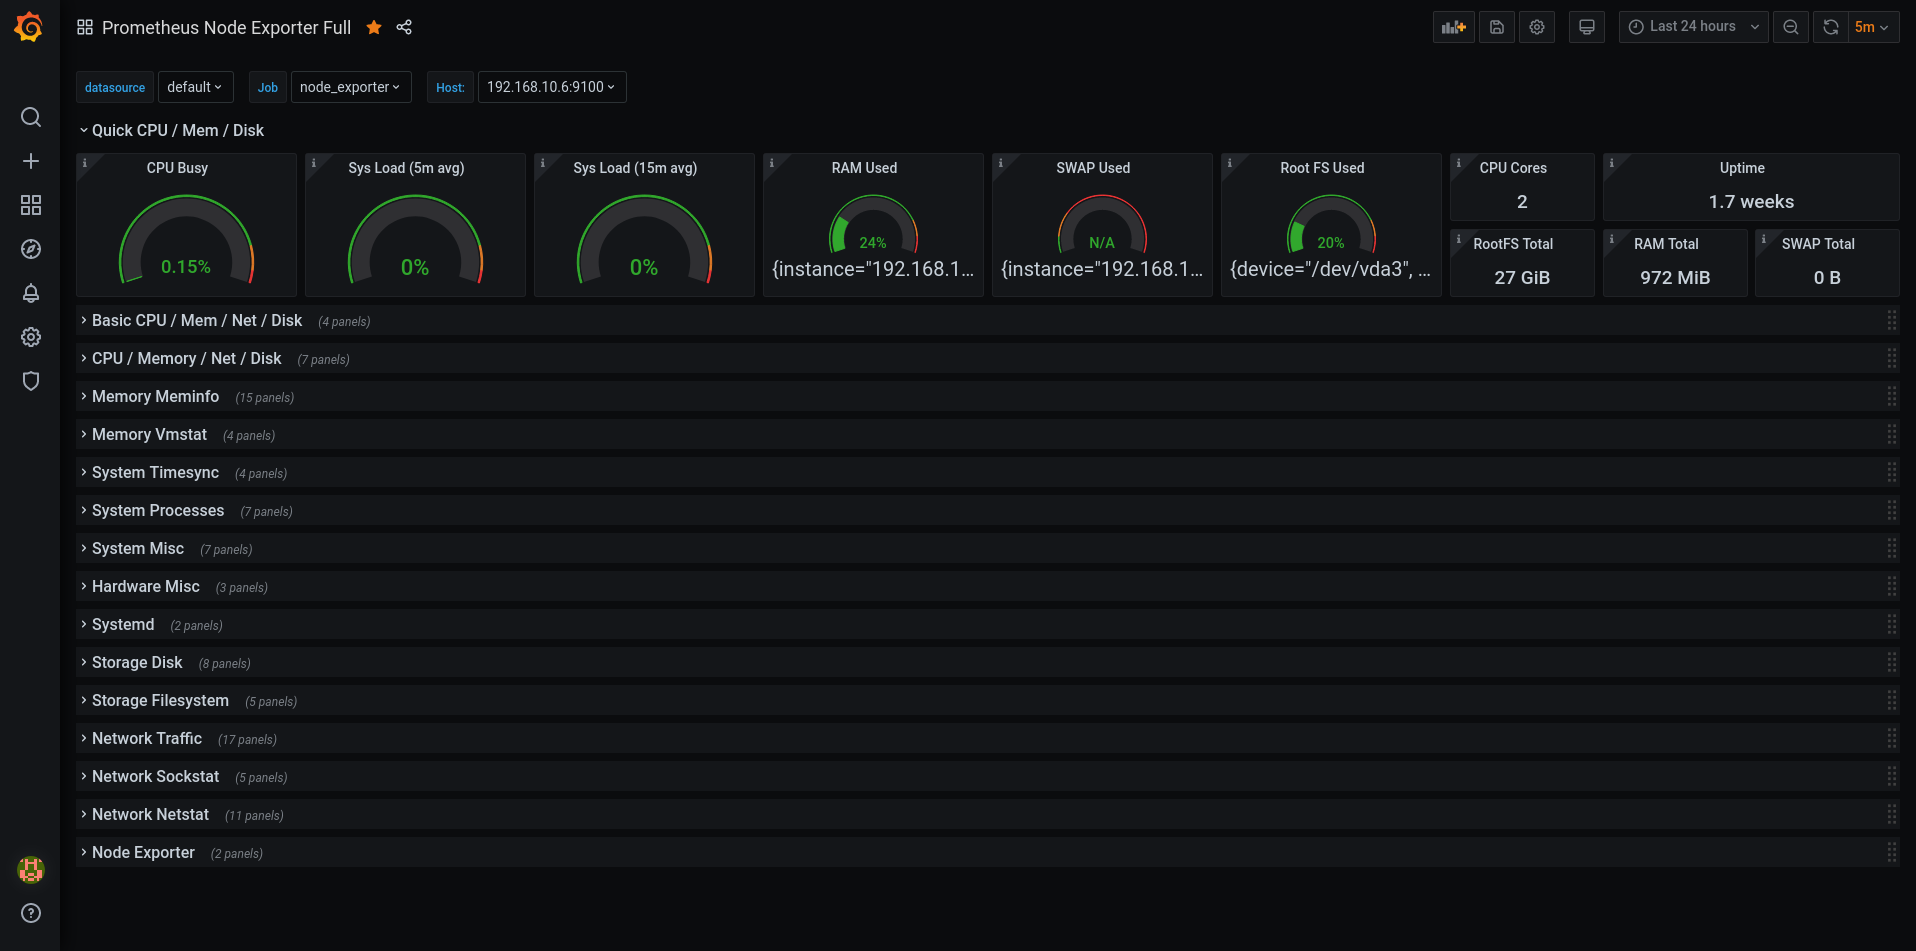
Here’s another dashboard that uses Node_exporter, but this time, it’s a more in-depth one for closer monitoring.
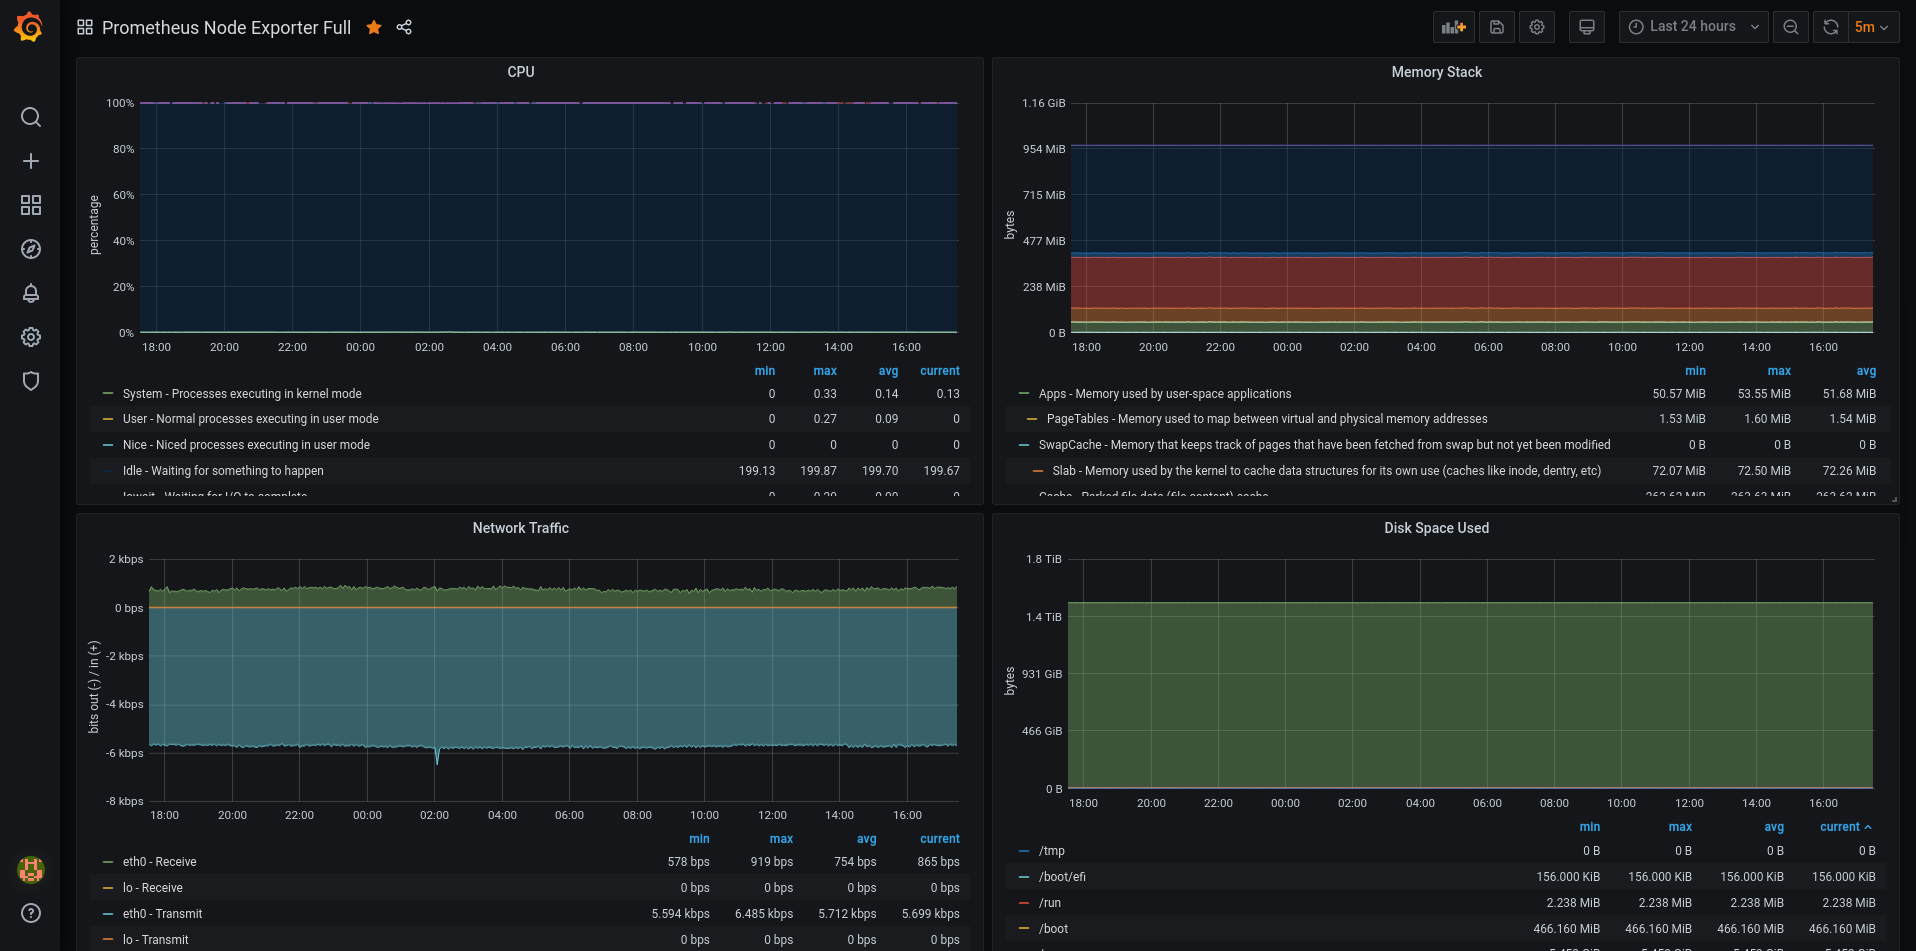
This dashboard is long and has a lot of data points being monitored, it’s pretty ridiculous what prometheus can gather. And it doesn’t really use a lot of CPU.
Here’s a view of what node_exporter provides:

This page has 4134 lines, of which about 2902 are pure data (not comments).
And here’s how Prometheus actually looks in the background, without the beauty of Grafana:
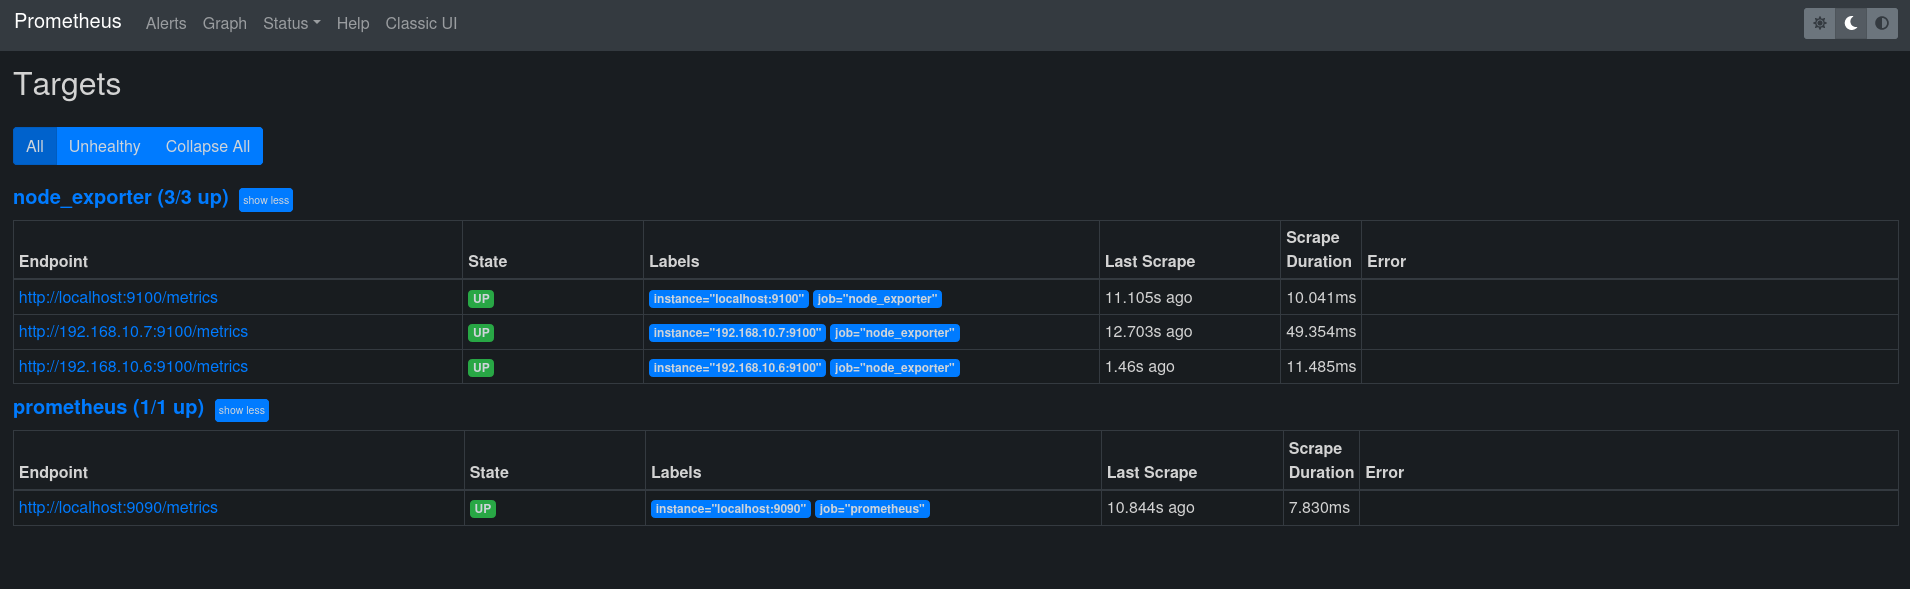
I disabled graphs, because grafana takes care of that. And I don’t have alerts set, as mentioned before. I estimate that, if you know how linux work, or at the very least how your distro of choice works and you have no idea about monitoring, but have fiddled with config files in the past (like sshd or apache / nginx), you should be able to set up a prometheus + grafana server and node_exporter clients in at most 2 hours. I believe 2 hours is a lot of time to be honest, considering that a somewhat experienced sysadmin like myself has set it up in just 15 minutes (and I’m no linux guru, it’s very likely I know way less stuff than Jay).
1 Like