Howdy.
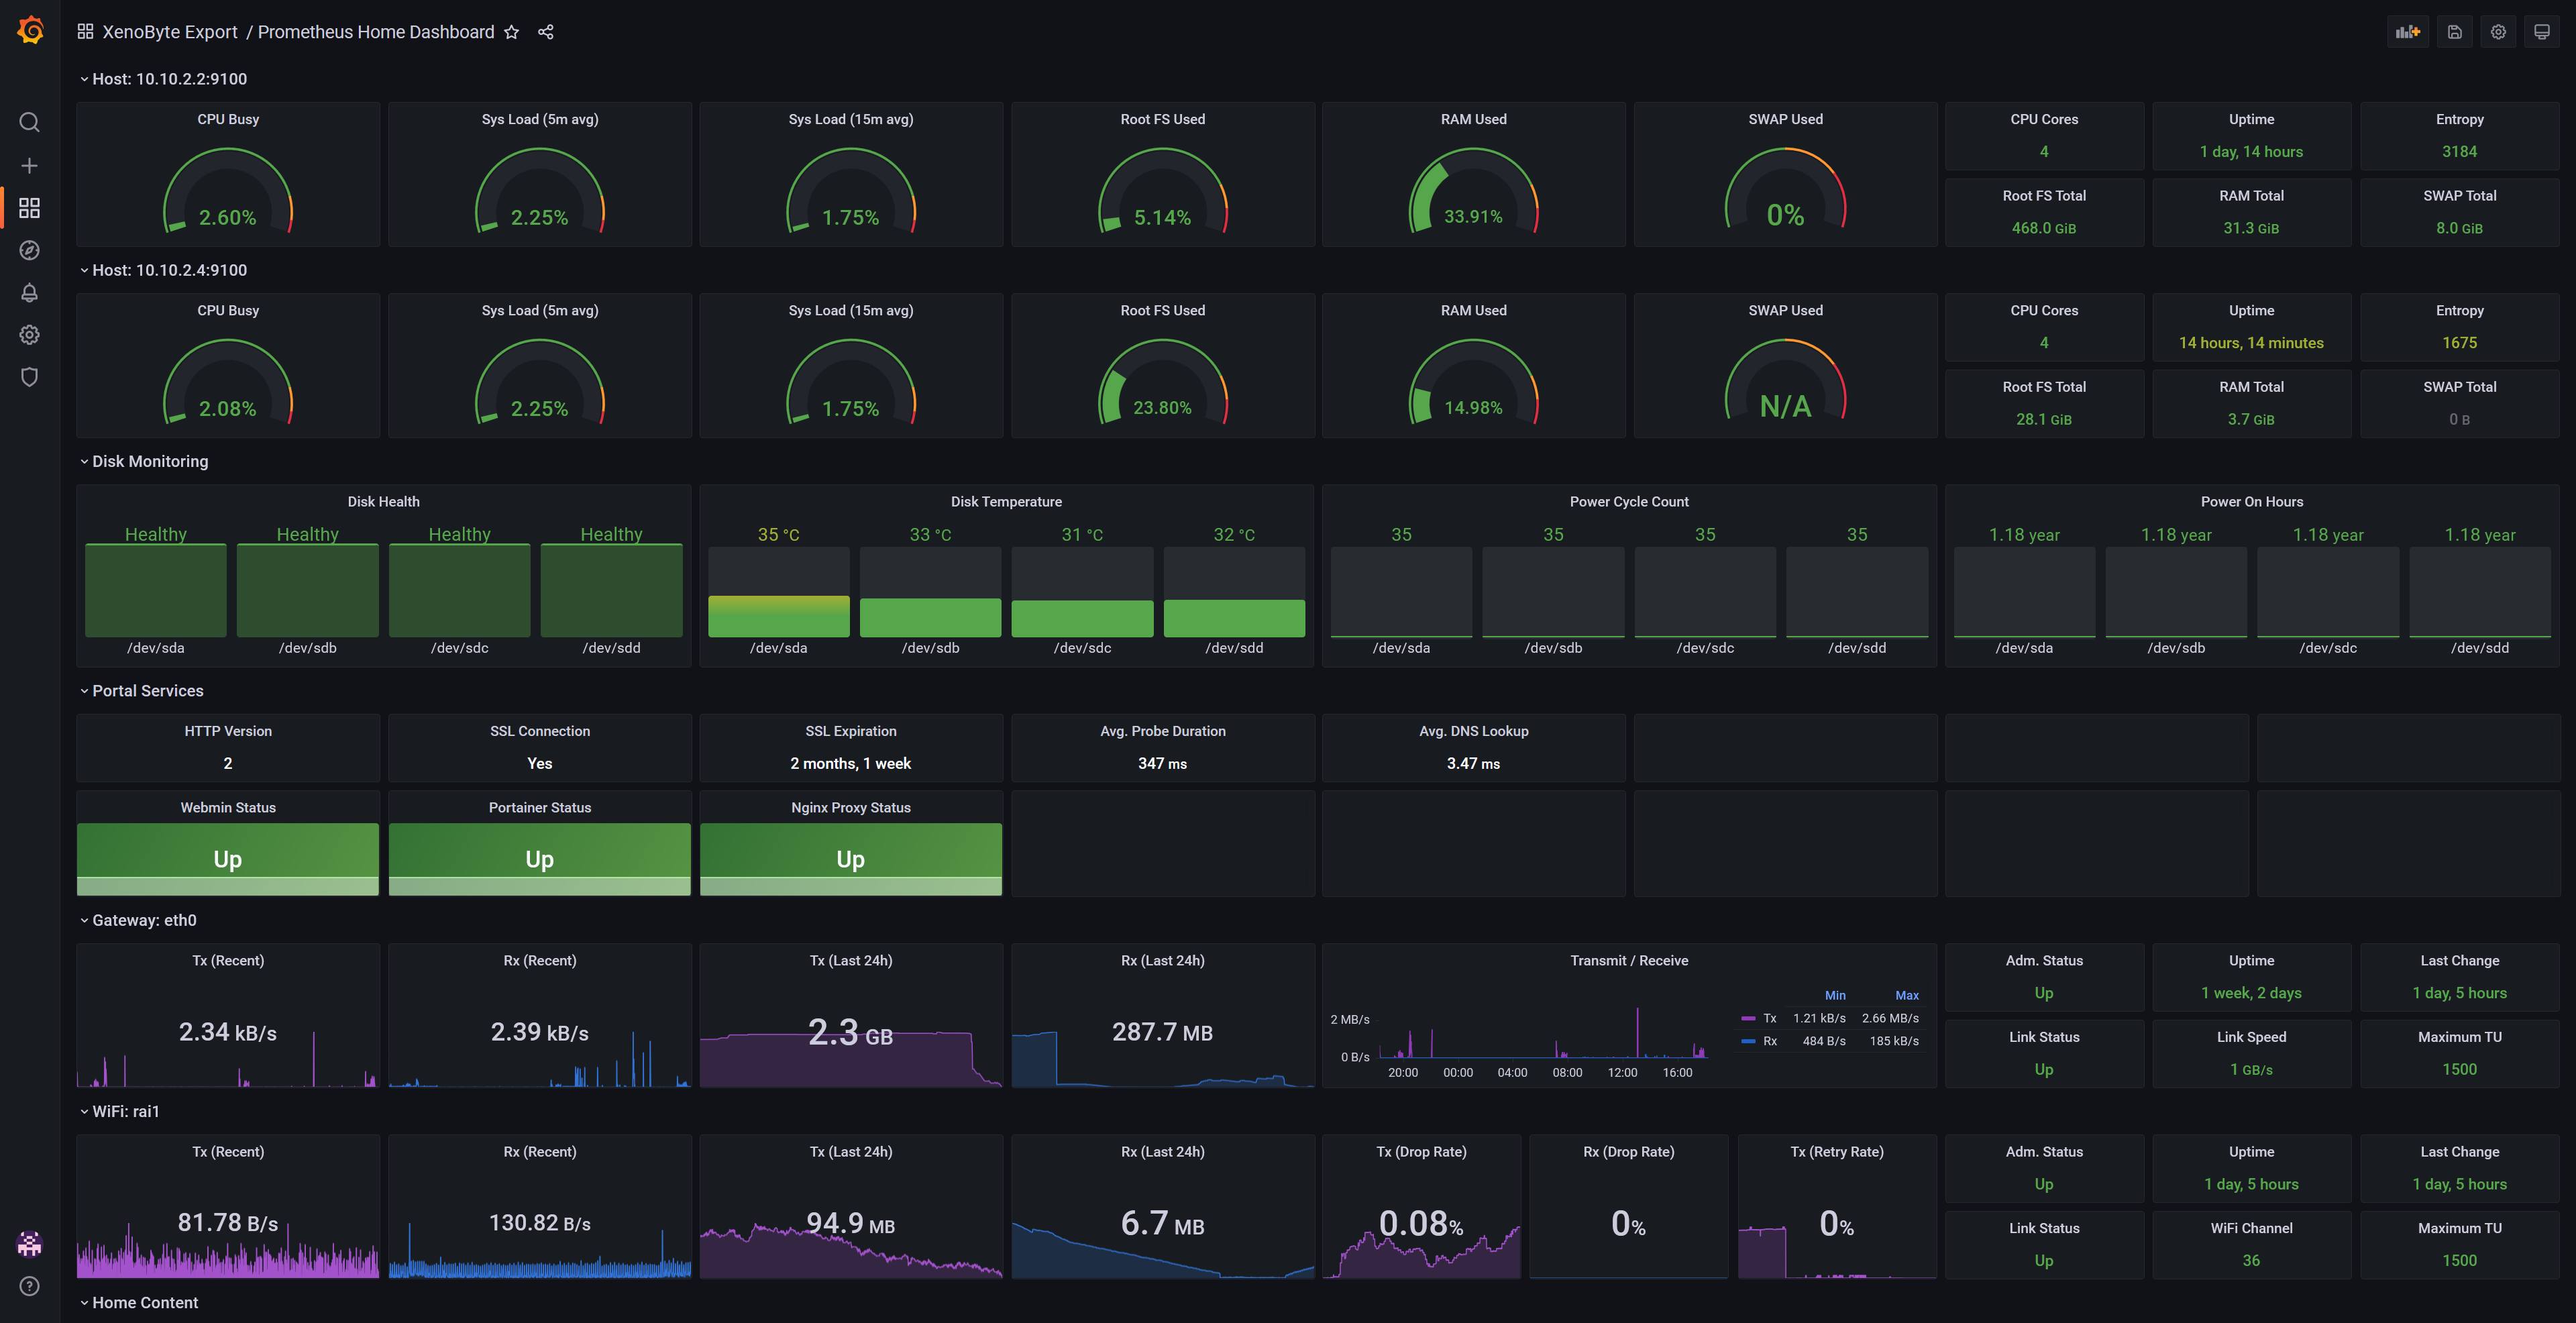
So I’ve been fiddling with my Grafana Dashboards lately, and thought I would post them here for inspiration.
They’re also shared on the Grafana Community. The full set of dashboards require the following stack to be running:
- Grafana
- Prometheus
- Prometheus Node Exporter (on each host)
- Prometheus Blackbox Exporter (web services)
- Prometheus SNMP Exporter (network)
I’m using Docker, and at a later point I can share the config files (after I strip them from possible sensitive information).
Here are screenshots and links to the Dashboards.
Prometheus Web Service Exporter
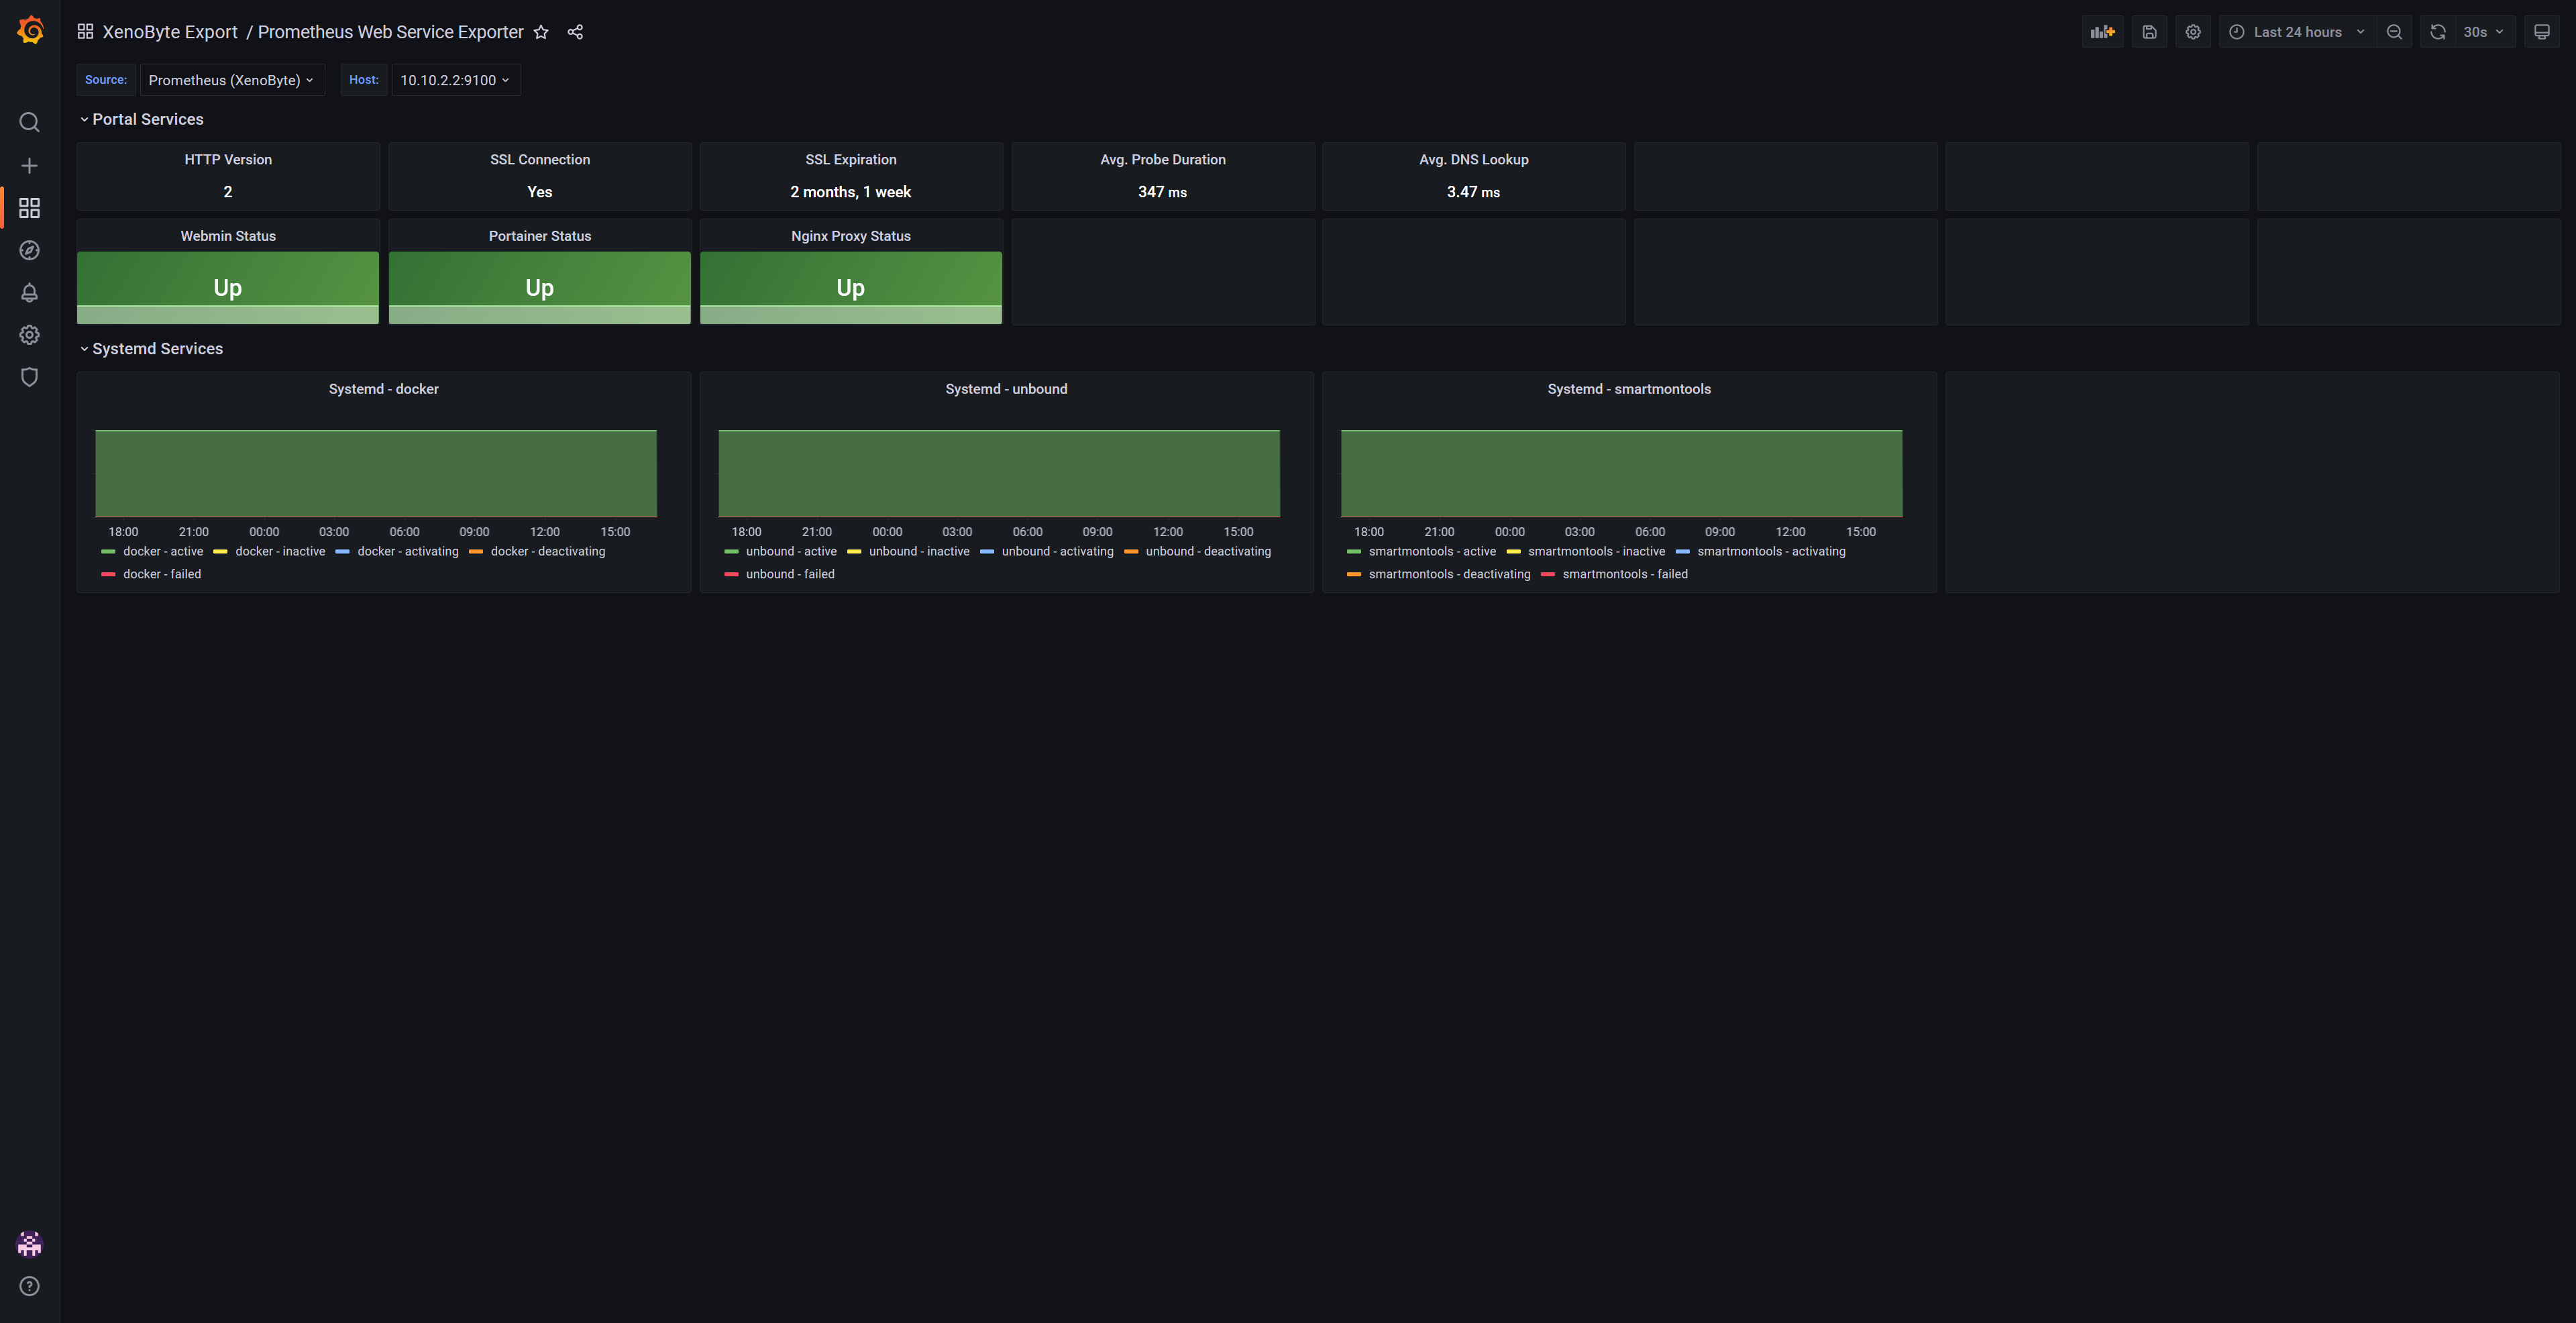

Unfortunately, until now this have to serve as inspiration, as the config files are not fully available.
No matter what, you’ll have to replace my Prometheus data source (XenoByte) with your own. But else, everything should be easily configurable using Grafana variables and constants.
But please do write me here if you need help configuring, until I get the configs online.
All feedback, improvements and suggestions welcome! ![]()
Cheers! ![]()
![]()

