Sorry if this is a dumb question… I don’t even know the correct terms to google for.
Is there an easy way to have different machines report their usage level to a single place. From there, is there a good tool to graph that information on a single page?
At this point, I am interested in tracking memory usage, CPU usage, and storage usage across a proxmox server and two different NASs, one Synology and one qnap.
Even just the correct keywords to search for would be appreciated.
This ranks pretty high on my accidental home lab priorities. I would be nice to have a single pane of glass to show memory, cpu, and storage consumption across all of my servers. Then if something seems to be nearing capacity I can shift things around or buy more of a specific resource.
I’ll go though the link I posted above a see what I can figure out. But, to be honest, I like your video style. They feel like they bring me up to the necessary level to understand have the various parts of a system fit together before I get down in the weeds.
I’m hoping to cover this topic as well as centralized logging as soon as I can. There’s some things I’ll catch up on and I’ll try to see where everything fits into my schedule. Sometimes the production quality going up can slow me down a bit, so I’m trying to figure out how to automate some of my video production so I can be quicker to cover topics.
The last time I really played with my network was in the early 2000’s when the NSLU2 came out and flashing router firmware was all the rage. Then, life and work seemed to take over.
Home labs and home networking (and google search) are now at a stage where one can set up a surprising polished system with just a few hours per week. Most importantly, for me, the tools are good enough that when something goes wrong I can find the issue or a least revert the change until I get some time to look into things.
Telegraf is the agent you install on the host to push metrics into InfluxDB. Telegraf has a huge config file, but is very easy to configure. Grafana is the dashboard engine.
I installed all three on a Debian server last week and used Ansible to install Telegram on 4 VM’s. Then I configured Telegram. Had everything up an running within 20 minutes. I did, however, have to configure /etc/telegraf/telegraf.conf to enable network interface monitoring and specify the name of the interface you want to monitor.
Here is the article I used to perform the install and configuration:
I’m personally using Grafana and Prometheus as Docker containers, with prometheus-node-exporter running on each machine I’m monitoring. This works very well for me.
Thanks,
I appreciate the suggestion. I’ll check out Prometheus.
Unless I am mistaken, monitoring and reporting seem to be one of the things that users and companies are often willing to pay to do correctly. I went through the Graylog homelab episode over the weekend and go a good feeling for how that works.
Depending on your needs, but, many of the heavy hitters have already been mentioned in this thread. The traditional ELK Stack (Producers, Storage, Processors, Grapher’s ) is a good starting point.
I ran across this one and bookmarked it some time back due to it’s Jupyter Notebook / Spark components.
I am thinking that I spent a ton of time working on getting the home/free versions of a vmware based infrastructure working. While it might be great in a large network, it was overly complex for my basic needs (and basic hardware.)
Proxmox meets my needs/willingness to deal with complexity almost perfectly. I am kind of hoping there is a similar type of monitoring tool.
For monitoring anything, Zabbix is an excellent tool and will run on a raspberry pi.
ELK or Splunk is a bit advanced. If you are new to monitoring, I’d recommend starting off with Grafana or Zabbix. But there are other tools out there. Nagios is popular as well.
I’ve been working in the application and network monitoring area for the past 15 years, so let me know if I can help.
I am going to try to set up a simple monitoring system that monitors my Proxmox server, my primary Synology NAS, my remote backup NAS, and my primary laptop with a couple of different systems.
As odd as it seems, my goal is a ‘set it and forget it’ system where I can trust my network is chugging along without any intervention by me.
Going to set up prometheus based system today… will try zabbix asap.
I like Grafana quite a bit. I was thinking of setting that up on my servers (which usually leads to a video) but I’ve gotten quite a bit behind schedule at the moment.
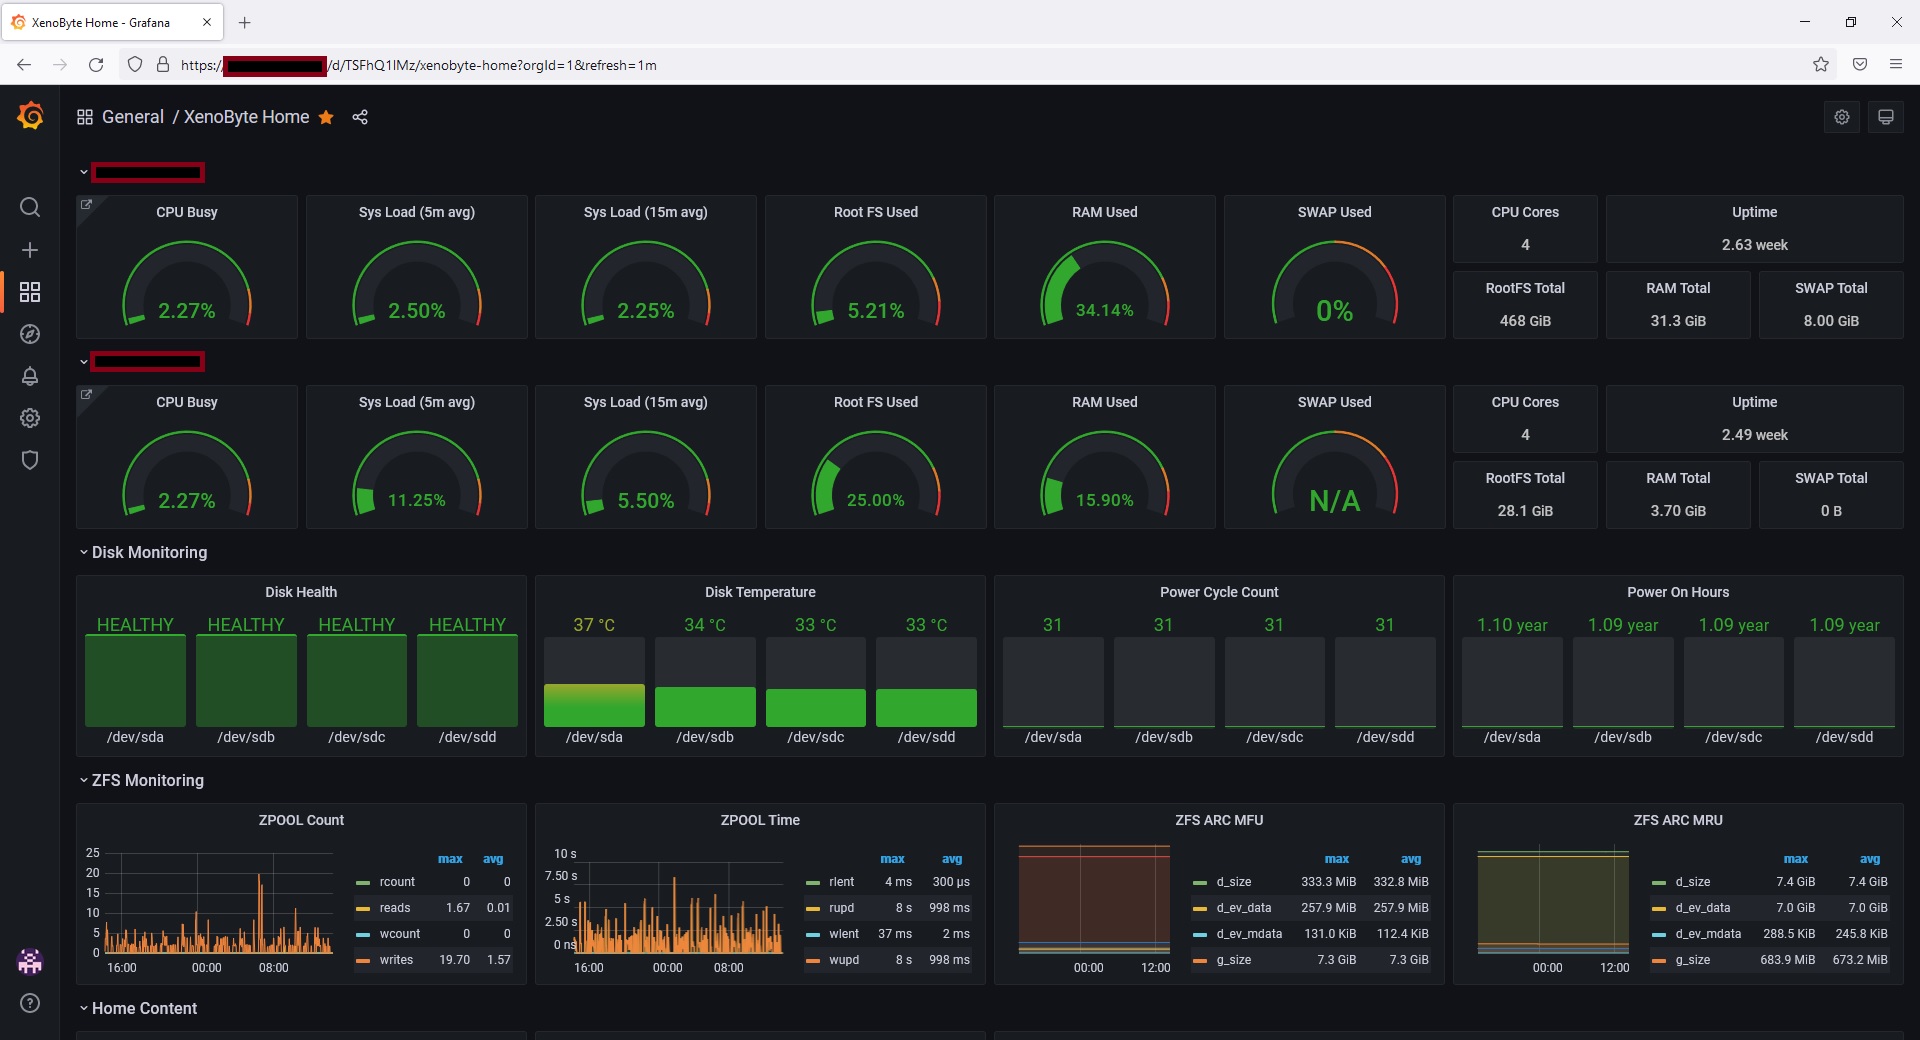
I would be interested in a video using Grafana and how to setup own graphs. More specifically, what things should we make available at a glance, given the limited “above the fold” space.
This has basic stats for my machines, as well as basic HDD and ZFS stats. And I link directly to the Node Exporter Full Dashboard for more detailed information.
I can’t got into great detail, but, my team manages several critical applications where we are responsible for all aspects of the deployment(s) (Bare metal servers, instances, patching, application performance, SLA’s etc). We have hundreds of nodes across virtually all regions where we have infrastructure (that list is growing rapidly). Prometheus and Grafana are two tools my team use extensively. When problems happen (it’s not a matter of if, it’s when), these tools (and others) prove invaluable for getting resources back on line and operating in peek condition.
In low volume scenarios, like most of us have in our home labs, the items you’ve chosen to monitor are solid choices (they apply equally at scale also). However, in High-Volume situation, things like: Networking, HTTP Requests, Stack Tracing, Thread Monitoring, Response Time Metrics, Database transactions, and more, all become critical in troubleshooting issues that may have originated down stream. Setting these metrics up can be no small task, but, the effort is well worth it when a problem crops up.
Anyone looking to work at scale in the DevOps / Cloud Infrastructure / Application Orchestration World would be wise to gain a good understanding of at least the basics of Prometheus and Grafana. Replicating the dashboard(s) you’ve done here would be a very good place to start.